Results
Part-of-Speech Tagging – Open Task
| Participants | POS TA | CPOS TA | POS UWTA | CPOS UWTA | Rank |
|---|---|---|---|---|---|
| SemaWiki 2 | 96.75% | 97.03% | 94.62% | 95.30% | 1 |
| SemaWiki 1 | 96.44% | 96.73% | 94.27% | 95.07% | 2 |
| SemaWiki 4 | 96.38% | 96.67% | 93.13% | 93.81% | 3 |
| SemaWiki 3 | 96.14% | 96.42% | 92.55% | 93.24% | 4 |
| Pianta | 96.06% | 96.36% | 92.21% | 93.24% | 5 |
| Lesmo | 95.95% | 96.26% | 92.33% | 93.01% | 6 |
| Tamburini 1 | 95.93% | 96.40% | 90.95% | 92.67% | 7 |
| Tamburini 2 | 95.63% | 96.16% | 91.07% | 92.78% | 8 |
Part-of-Speech Tagging – Closed Task
| Participants | POS TA | CPOS TA | POS UWTA | CPOS UWTA | Rank |
|---|---|---|---|---|---|
| Felice_ILC | 96,34% | 96,91% | 91,07% | 93,36% | 1 |
| Gesmundo | 95,85% | 96,48% | 91,41% | 93,81% | 2 |
| SemaWiki 2 | 95,73% | 96,52% | 90,15% | 93,47% | 3 |
| SemaWiki 1 | 95,24% | 96,00% | 87,40% | 90,72% | 4 |
| Pianta | 93,54% | 94,10% | 85,45% | 87,74% | 5 |
| Rigutini 2 | 93,37% | 94,15% | 86,03% | 88,43% | 6 |
| Rigutini 3 | 93,31% | 94,15% | 6,03% | 88,55% | 7 |
| Rigutini 4 | 93,29% | 94,17% | 85,34% | 88.09% | 8 |
| Rigutini 1 | 93,10% | 93,76% | 84,54% | 87,06% | 9 |
| CSTSøgaard 1 | 91,90% | 93,21% | 86,03% | 89,58% | 10 |
| CSTSøgaard 2 | 91,64% | 93,21% | 86,14% | 89,92% | 11 |
Dependency Parsing Track
Dependency parsing MDS: evaluation on all the test set (240 sentences)
| Participants | LAS | UAS | p-value |
|---|---|---|---|
| UniTo_Lesmo_PAR | 88.73 | 92.28 | 0.472 |
| UniPi Attardi DPAR | 88.67 | 92.72 | 0.0001 |
| FBKirst Lavelli DPAR | 86.5 | 90.96 | 0.005 |
| UniAmsterdam Sangati DPAR | 84.98 | 89.07 | 0.0001 |
| UniCopenhagen Soegaard DPAR | 80.42 | 89.05 | 0.0001 |
| CELI Dini DPAR | 68 | 77.95 | – |
Dependency parsing PDS: evaluation on all the test set (260 sentences)
| Participants | LAS | UAS | p-value |
|---|---|---|---|
| UniPi Attardi DPAR | 83.38 | 87.71 | 0.0001 |
| FBKirst Lavelli DPAR | 80.54 | 84.85 | 0.0012 |
| UniCopenhagen Soegaard DPAR | 78.51 | 85.81 | 0.0001 |
| UniTo Lesmo DPAR | 73.44 | 80.80 | 0.0001 |
| CELI Dini DPAR | 57.81 | 64.10 | – |
Dependency parsing MDS: evaluation on the shared test set (100 sentences from newspaper), the civil law (100 sentences) and passage (40 sentences)
| Participants | shared | civillaw | passage | |||
|---|---|---|---|---|---|---|
| LAS | UAS | LAS | UAS | LAS | UAS | |
| UniPi Attardi DPAR | 82.60 | 95.02 | 92.63 | 95.38 | 90.10 | 92.90 |
| UniTo Lesmo DPAR | 84.68 | 89.73 | 91.54 | 94.64 | 89.36 | 91.58 |
| FBKirst Lavelli DPAR | 79.91 | 87.15 | 90.23 | 93.33 | 89.11 | 91.75 |
| UniAmsterdam Sangati DPAR | 76.66 | 87.99 | 89.93 | 95.51 | 87.87 | 93.89 |
| UniCopenhagen Soegaard DPAR | 72.84 | 81.93 | 86.04 | 90.27 | 80.94 | 85.31 |
| CELI Dini DPAR | 63.86 | 70.15 | 70.74 | 74.97 | 68.89 | 73.35 |
Dependency parsing PDS: evaluation on the shared test set (100 sentences from newspapers), and the remaining test corpus (160 sentences)
| Participants | shared | rest | ||
|---|---|---|---|---|
| LAS | UAS | LAS | UAS | |
| UniPi Attardi DPAR | 84.67 | 88.99 | 82.70 | 87.04 |
| FBKirst Lavelli DPAR | 81.12 | 85.02 | 80.24 | 84.76 |
| UniCopenhagen Soegaard DPAR | 78.61 | 85.26 | 78.45 | 86.10 |
| UniTo Lesmo DPAR | 75.12 | 82.58 | 72.56 | 79.88 |
| CELI Dini DPAR | 60.78 | 67.07 | 56.27 | 62.55 |
Constituency Parsing Track
Constituency parsing: evaluation on all the test set (200 sentences)
| Participants | LF | LR | LP | P for LR | P for LP |
|---|---|---|---|---|---|
| FBKirst Lavelli CPAR | 78.73 | 80.02 | 77.48 | 0.1592 | 0.0021 |
| UniAmsterdam Sangati CPAR | 75.79 | 78.53 | 73.24 | – | – |
Constituency parsing: separate evaluation on the newspaper (100 sentences) and civil law (100 sentences) test set.
| Participants | newspaper | civillaw | ||||
|---|---|---|---|---|---|---|
| LF | LR | LP | LF | LR | LP | |
| FBKirst Lavelli DPAR | 76.21 | 76.08 | 76.34 | 80.66 | 83.15 | 78.33 |
| UniAmsterdam Sangati DPAR | 74.33 | 76.08 | 72.65 | 76.93 | 80.47 | 73.69 |
Lexical Substitution
Results obtained using the scoring type best
| Participants | Prec. | Rec. | F | mode P | mode R |
|---|---|---|---|---|---|
| uniba2 | 8.16 | 7.18 | 7.64 | 10.58 | 10.58 |
| baroniCutugnoLenciPucci | 6.26 | 6.01 | 6.13 | 11.28 | 10.84 |
| uniba1 | 6.80 | 5.53 | 6.10 | 8.90 | 8.90 |
| uniba3 | 6.28 | 5.46 | 5.84 | 8.13 | 8.13 |
| decao3 | 3.95 | 3.21 | 3.54 | 6.58 | 6.58 |
| decao2 | 3.90 | 3.17 | 3.50 | 6.71 | 6.71 |
| decao1 | 3.16 | 3.16 | 3.16 | 6.97 | 6.97 |
| decao4 | 3.52 | 2.80 | 3.12 | 5.03 | 5.03 |
| baseline psc | 10.86 | 9.06 | 9.88 | 13.94 | 13.94 |
| baseline iwn psc | 9.71 | 8.19 | 8.89 | 13.16 | 13.16 |
| baseline iwn | 2.72 | 1.78 | 2.15 | 2.19 | 2.19 |
Results obtained using the scoring type oot
| Participants | Prec. | Rec. | F | mode P | mode R |
|---|---|---|---|---|---|
| uniba2 | 41.46 | 36.50 | 38.82 | 47.23 | 47.23 |
| uniba1 | 37.74 | 30.69 | 33.85 | 34.84 | 34.84 |
| uniba3 | 28.54 | 24.79 | 26.53 | 34.58 | 34.58 |
| decao3 | 23.48 | 19.11 | 21.07 | 26.58 | 26.58 |
| decao2 | 23.00 | 18.72 | 20.64 | 26.32 | 26.32 |
| decao1 | 20.09 | 20.09 | 20.09 | 27.74 | 27.74 |
| decao4 | 18.62 | 14.78 | 16.48 | 20.52 | 20.52 |
| baroniCutugnoLenciPucci | 16.65 | 16.00 | 16.32 | 24.97 | 24.00 |
| baseline iwn psc | 27.52 | 23.23 | 25.19 | 37.24 | 32.39 |
| baseline psc | 23.00 | 19.20 | 20.93 | 26.97 | 26.97 |
| baseline iwn | 14.51 | 9.51 | 11.49 | 12.77 | 12.77 |
Named Entity Recognition
Systems’ results in terms of F-Measure, Precision and Recall
| Participants | Over. | Over. | Over. | F1 | |||
|---|---|---|---|---|---|---|---|
| FB1 | Prec. | Rec. | GPE | LOC | ORG | PER | |
| FBK_ZanoliPianta | 82.00 | 84.07 | 80.02 | 85.13 | 51.24 | 70.56 | 88.31 |
| UniGen_Gesmundo_r2 | 81.46 | 86.06 | 77.33 | 83.36 | 50.81 | 71.08 | 87.41 |
| UniTN-FBK-RGB_r2 | 81.09 | 83.20 | 79.08 | 85.25 | 52.24 | 69.61 | 86.69 |
| UniTN-FBK-RGB_r1 | 80.90 | 83.05 | 78.86 | 85.19 | 54.62 | 69.41 | 86.30 |
| UniTN_Nguyen_r1 | 79.77 | 82.26 | 77.43 | 82.85 | 42.34 | 67.89 | 86.44 |
| UniTN_Nguyen_r2 | 79.61 | 81.65 | 77.67 | 82.49 | 50.85 | 67.38 | 86.25 |
| UniGen_Gesmundo_r1 | 76.21 | 83.92 | 69.79 | 79.07 | 47.06 | 64.67 | 82.04 |
| UniTN_Rigo_r2 | 74.98 | 81.08 | 69.73 | 75.96 | 38.32 | 60.36 | 83.18 |
| UniTN_Rigo_r1 | 74.34 | 80.71 | 68.91 | 75.77 | 31.16 | 59.87 | 82.38 |
| UniPI-ILC-CNR_r2 | 69.67 | 75.42 | 64.74 | 71.42 | 38.91 | 58.37 | 76.38 |
| UniPI-ILC-CNR_r1 | 67.98 | 73.65 | 63.11 | 71.66 | 27.45 | 57.02 | 73.85 |
| ECNU_Cai | 61.03 | 65.55 | 57.09 | 69.25 | 28.72 | 51.49 | 63.49 |
| BASELINE | 43.99 | 42.80 | 45.25 | 69.00 | 37.07 | 45.54 | 32.06 |
| BASELINE –u | 39.14 | 40.58 | 37.80 | 52.75 | 28.57 | 44.23 | 32.10 |
Local Entity Detection and Recognition
Percentages for Value, Precision, Recall and F-measure of the participating system
| Participants | LEDR | EMD | ||||||
|---|---|---|---|---|---|---|---|---|
| Value | Prec. | Rec. | F | Value | Prec. | Rec. | F | |
| FBKirst_UNITN | 36.7% | 78.5% | 61.1% | 68.7% | 65,7% | 78,1% | 74,1% | 76,1% |
Textual Entailment
| Run | Correct | Accuracy |
|---|---|---|
| FBKirst_run1.txt | 285 | 0.71 |
| FBKirst_run2.txt | 282 | 0.71 |
| ofe_semTypes_1.txt | 257 | 0.64 |
| ofe_semTypes_2.txt | 228 | 0.57 |
| ofe_lexical_2.txt | 230 | 0.58 |
| ofe_lexical_1.txt | 225 | 0.56 |
| FBKirst_run4.txt | 202 | 0.51 |
| FBKirst_run3.txt | 199 | 0.50 |
Connected Digits Recognition
Clean ASR task. Results are ordered by Word Accuracy. In the last column, T means that a non-official training was used, L means that the results were delivered late.
| Systems | Sentence Acc. | Word Acc. | Words | Corr. | Err | Del+Ins+Sub | |
|---|---|---|---|---|---|---|---|
| ISTC-SONIC_2 | 96.44% | 99.45% | 2360 | 2353 | 13 | 7+6+0 | |
| ISTC-SONIC_1 | 96.44% | 99.45% | 2360 | 2350 | 13 | 8+3+2 | |
| ISTC-SPHINX_1 | 96.16% | 99.32% | 2360 | 2352 | 16 | 4+8+4 | |
| ABLA-NUANCE | 95.89% | 99.28% | 2360 | 2345 | 17 | 6+2+9 | T |
| ISTC-OGI_1 | 95.62% | 99.19% | 2360 | 2346 | 19 | 6+5+8 | |
| ISTC-OGI_2 | 94.25% | 98.94% | 2360 | 2342 | 25 | 11+7+7 | |
| ISTC-SPHINX_2 | 93.70% | 98.77%% | 2360 | 2345 | 29 | 6+14+9 | |
| CEDAT85 | 89.59% | 98.05% | 2360 | 2333 | 46 | 5+19+22 | T |
| ABLA-TSPEECH | 81.64% | 96.06% | 2360 | 2270 | 93 | 34+3+56 | T |
| UNINA | 18.36% | 77.84% | 2360 | 1941 | 523 | 116+104+303 | L |
Noisy ASR task Results are ordered by Word Accuracy. In the last column, T means that a non-official training was used.
| Participants | Sentence Acc. | Word Acc. | Words | Corr. | Err | Del+Ins+Sub | |
|---|---|---|---|---|---|---|---|
| ISTC-SONIC_2 | 87.77% | 96.21% | 4036 | 3896 | 153 | 104+13+36 | |
| ISTC-SONIC_1 | 86.45% | 95.91% | 4036 | 3882 | 165 | 105+11+49 | |
| ISTC-OGI_2 | 81.82% | 93.95% | 4036 | 3821 | 244 | 121+29+94 | |
| ISTC-SPHINX_1 | 79.17% | 93.06% | 4036 | 3807 | 280 | 136+51+93 | |
| ISTC-OGI_1 | 81.65% | 99.45% | 4036 | 3767 | 306 | 135+37+134 | |
| ISTC-SPHINX_2 | 72.56% | 91.63% | 4036 | 3779 | 338 | 133+81+124 | |
| CEDAT85 | 78.02% | 91.03% | 4036 | 2353 | 362 | 255+36+71 | T |
| ABLA-NUANCE | 77.69% | 88.65% | 4036 | 3604 | 458 | 268+26+164 | T |
| ABLA-NUANCE | 69.09% | 82.23% | 4036 | 3375 | 717 | 467+56+194 | T |
Spoken Dialogue Systems Evaluation
Dialog level statistics
| Participants | Duration (sec) | Duration (# Turns) |
|---|---|---|
| UniNA | 145.8±72.7 | 11.0±5.7 |
| Loquendo | 182.2±84.7 | 18.9±8.9 |
| UniTN | 206.4±81.7 | 24.4±10.1 |
Task durations (#turns: mean±std.dev.) and success rates
| Task | UniNA | Loquendo | UniTN | |||
|---|---|---|---|---|---|---|
| Duration (turns) | Tsr (corr/req) | Duration (turns) | Tsr (corr/req) | Duration (turns) | Tsr (corr/req) | |
| Identify representative | 1.9 ± 0.4 | 100.0% (19/19) | 2.4 ± 0.8 | 95.0% (19/20) | 3.1 ± 0.5 | 90.5% (19/21) |
| Ask customer detail | 2.0 ± 0.0 | 83.3% (5/6) | 2.3 ± 0.5 | 88.9% (8/9) | 3.4 ± 1.6 | 54.6% (12/22) |
| List orders | 2.5 ± 1.5 | 0.0% (0/8) | 2.0 ± 0.0 | 80.0% (4/5) | 3.0 ± 0.0 | 75.0% (3/4) |
| Show last order | 2.0 ±0.0 | 100% (1/1) | – | – | – | – |
| List customers | 2.0 ± 0.0 | 50.0% (2/4) | 2.0 ± 0.0 | 0.0% (0/8) | 3.0 ± 0.0 | 66.7% (2/3) |
| New order | 4.6 ± 1.5 | 36.4% (4/11) | 4.3 ± 1.8 | 42.9% (9/21) | 7.5 ± 2.8 | 63.2% (12/19) |
| List products by category | 3.0 ± 1.0 | 14.3% (1/7) | – | – | 3.0 ± 0.0 | 100.0% (3/3) |
| List products by brand | – | – | – | – | 3.0 ± 0.0 | 50.0% (1/2) |
| List products – other | 2.0 ± 0.0 | 0.0% (0/4) | 3.0 ± 0.8 | 25.0% (2/8) | 3.8 ± 1.6 | 44.4% (4/9) |
| Search single product | 2.3 ± 0.4 | 55.6% (5/9) | 2.8 ± 1.6 | 77.8% (14/18) | 3.5 ± 2.5 | 78.6% (11/14) |
| Ask for help | 2.0 ± 0.0 | 100% (3/3) | – | – | 2.0 ± 0.0 | 100.0% (2/2) |
| Exit application | 2.5 ± 0.5 | 100.0% (5/5) | – | 0.0% (0/1) | 2.4 ± 0.8 | 25.0% (4/16) |
| OVERALL (corr/req) | – | 58.4% (45/77) | – | 62.2% (56/90) | – | 63.5% (73/115) |
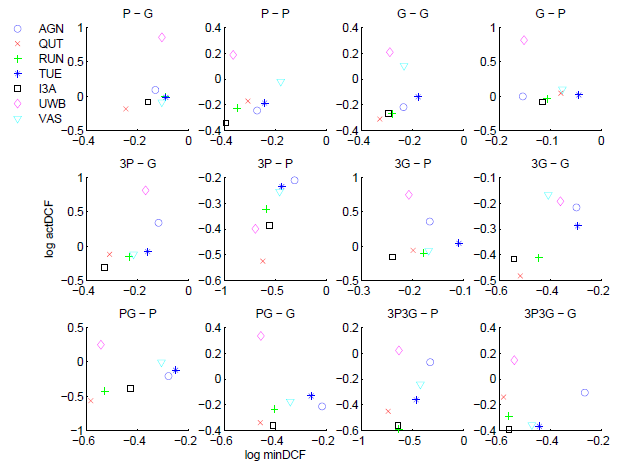
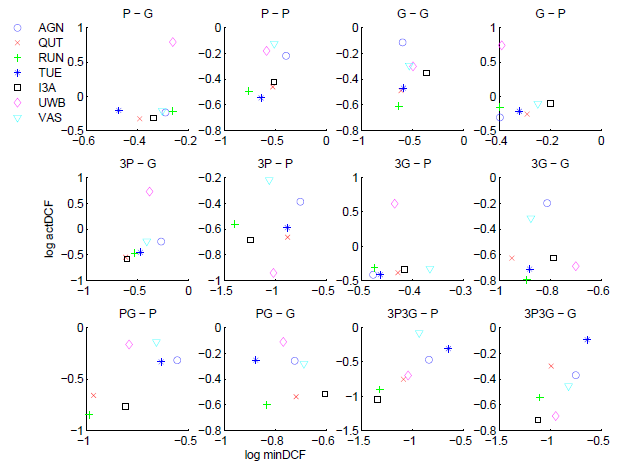
Speaker Identity Verification
Application Track.
DCF analysis for TS1. Axes are log base 10 of normalized DCF.
DCF analysis for TS2. Axes are log base 10 of normalized DCF.
Forensic Track.
For detailed information about the results, please see the report